Mastering Trading View: Advanced Strategies for Smarter Market Analysis
Unlocking the Full Potential of Trading View: A Comprehensive Guide for Traders and Investors
In today’s fast-paced financial markets, having access to reliable, sophisticated, and user-friendly charting and analysis tools is essential for traders and investors aiming to stay ahead of the curve. One platform that has gained significant recognition worldwide is trading view. Renowned for its powerful charting capabilities, extensive social trading community, and seamless integration with various markets, Trading View offers a comprehensive environment for market analysis and decision-making. This guide delves into the core features, advanced techniques, best practices, and optimization strategies that can elevate your trading success with Trading View.
Understanding the Core Features of Trading View
At the heart of Trading View lies an extensive suite of tools designed to facilitate detailed market analysis. Its core features center around intuitive charting, a vast collection of indicators, social interaction, and real-time data access, making it an indispensable platform for both novice and professional traders.
Popular Charting Tools and Indicators
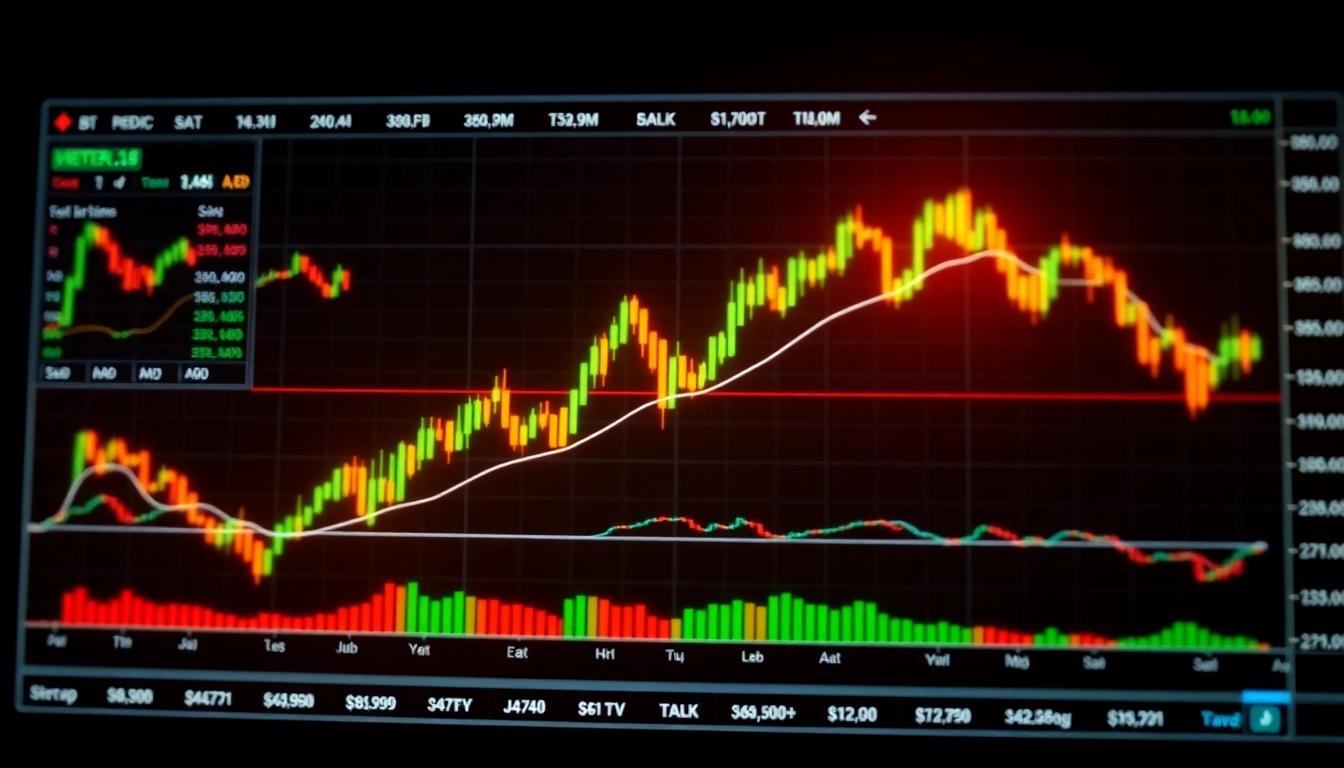
Trading View’s charting tools are renowned for their flexibility and customization. Users can select from a myriad of chart types—line, candlestick, bar, and more—adapting visuals to their trading style. The platform offers an impressive library of technical indicators, including Moving Averages, RSI, Bollinger Bands, MACD, Fibonacci retracements, and dozens more. Additionally, custom indicators can be created using Pine Script, Trading View’s proprietary scripting language, allowing traders to tailor their analysis tools precisely to their strategies.
This expansive toolkit enables traders to identify entry and exit points, spot divergences, and analyze market volatility with precision. For example, traders can layer multiple indicators—like combining RSI with Moving Averages—to generate confluence signals that improve trade accuracy.
Social Trading and Community Insights
Beyond technical analysis, Trading View fosters a vibrant social community where traders and investors share ideas, strategies, and market forecasts. The platform’s “Ideas” section hosts millions of user-generated charts and analyses, providing diverse perspectives on market movements. Engaging with these insights can help traders validate their analysis, learn new techniques, and stay updated on market sentiment shifts.
Additionally, real-time comment threads, chat groups, and follower networks facilitate interactive learning and collaboration, turning Trading View into a social hub for financial discourse. Notably, the platform’s integration with social media—like Twitter and Instagram—amplifies community engagement beyond Trading View itself.
Integrating Trading View with Your Trading Strategy
With its comprehensive charting and social features, Trading View seamlessly integrates into various trading strategies. Whether you prefer technical analysis, fundamental insights, or a combination, the platform provides the necessary tools for rigorous evaluation. Traders can also connect Trading View with brokerage accounts that support direct trading through the platform, enabling rapid execution of analysis-based decisions.
Optimizing Your Trading View Setup for Success
Effective utilization of Trading View involves personalized setup and continuous adjustment to match your evolving trading needs. Key areas include customizing watchlists, setting alerts, using multi-time frame analysis, and leveraging technical tools to stay ahead.
Customizing Watchlists and Alerts
Creating tailored watchlists helps traders monitor specific assets efficiently. Trading View allows users to organize their favorite stocks, cryptocurrencies, commodities, or indices into customizable lists, streamlining market tracking. Alerts can be set for price levels, indicator signals, or drawing-based events, ensuring traders receive timely notifications without constantly monitoring the screen.
For example, a day trader might set an alert when Bitcoin crosses a certain resistance level, prompting immediate review or trade execution. Alerts can be delivered via SMS, email, or platform notifications, enabling swift action in volatile markets.
Using Multiple Time Frames Effectively
An essential principle of technical analysis is multi-time frame assessment. Trading View facilitates viewing charts across different scales—such as daily, hourly, or minute charts—simultaneously. This approach helps traders identify larger trend directions while fine-tuning entry and exit points on shorter time frames.
Practitioners often use higher time frames to establish trend context and lower time frames for precise trade timing, reducing false signals and increasing trade confidence.
Leveraging Technical Analysis Tools
Trading View’s technical analysis suite extends beyond indicators to include drawing tools, pattern recognition, and annotations. Drawing trendlines, channels, Fibonacci levels, and shapes help visualize support/resistance zones, potential breakout points, and market patterns.
Combining these graphical tools with indicators enhances the robustness of your analysis, supporting more informed trading decisions and disciplined execution.
Advanced Trading View Techniques
Once familiar with basic features, traders can explore advanced techniques that leverage Trading View’s scripting and automation capabilities to refine their strategies.
Automating Trades and Alerts with Scripts
Pine Script allows users to create custom indicators, alerts, and trading algorithms. Automating alerts ensures real-time notification about specific conditions, while automated trading scripts can execute trades based on predefined criteria, minimizing emotional bias.
For example, a trader might develop a script that signals when several indicators converge or automatically places a trade when certain patterns are detected, streamlining rapid decision-making in volatile markets.
Analyzing Market Trends with Proprietary Indicators
Beyond standard indicators, advanced traders develop proprietary tools tailored to their unique strategies. Pine Script facilitates this customization, enabling the creation of indicators that better capture market nuances—such as custom oscillators, volatility measures, or sentiment indicators.
Utilizing these bespoke tools can provide a competitive edge, especially when combined with traditional analysis methods.
Backtesting Strategies on Trading View
Backtesting involves simulating trades based on historical data to evaluate a strategy’s effectiveness. Trading View’s strategy tester allows traders to validate their approaches, adjust parameters, and optimize performance before deploying real capital.
Robust backtesting helps identify consistent setups and risk management rules, reducing susceptibility to overfitting and enhancing long-term profitability.
Best Practices for Market Analysis with Trading View
Effective market analysis combines the technical prowess of Trading View with disciplined habits and community insights. Adopting best practices ensures consistent improvements and better decision outcomes.
Utilizing Real-Time Data for Quick Decision Making
Trading View provides real-time data for a vast array of markets—stocks, cryptocurrencies, forex, commodities, and more. Access to instantaneous information enables traders to react swiftly to news events, market shifts, and emerging patterns, which is crucial in volatile environments.
Community Engagement for Market Predictions
Leveraging the platform’s social features allows traders to gauge market sentiment and validate their analysis. Reading community ideas, participating in discussions, and observing influential traders’ perspectives can provide valuable insights, especially when combined with personal analysis.
Maintaining a Disciplined Trading Routine
Discipline is paramount in trading. Setting predefined entry and exit rules, adhering to stop-loss and take-profit levels, and journaling trades foster consistency. Trading View’s comprehensive tools support disciplined trading by making it easy to follow these routines and review past performance.
Measuring and Improving Your Trading View Performance
Continuous assessment of your strategies and setups ensures ongoing development and adaptation to changing markets.
Tracking Your Trading Success Metrics
Monitor key metrics such as win rate, risk-reward ratio, drawdowns, and overall profitability, using Trading View’s chart annotations and trade logs. Regular reviews identify strengths and areas for improvement.
Adjusting Strategies Based on Market Feedback
Markets evolve, and static strategies often underperform over time. Incorporating feedback by refining indicators, optimizing scripts, or adjusting risk parameters ensures your approach remains relevant and profitable.
Integrating Trading View Data with Other Platforms
For enhanced functionality, traders often integrate Trading View with brokerage accounts, news feeds, or analytical tools. Using APIs or third-party connectors can streamline data flow, automate execution, and expand analytical capabilities.


